
Technology
Ensuring Quality and Security with ISO 9001 and ISO 27001 Certifications
ISO certifications play a vital role in ensuring organisations’ quality and security standards across various...

Before we dive into Microsoft Power BI, let’s first look at what business intelligence means and why it’s essential in today’s modern business setting.
Business intelligence (BI) is a term that refers to technologies, applications and practices for the collection, integration, analysis, and presentation of business information. BI aims to enable better decision-making by providing timely, accurate, and actionable information to business users. It can support various decision-making activities, from strategic planning to operational decision-making.
BI technologies and applications can be divided into two main categories: reporting and analytics. Reporting tools allow users to generate reports based on data from one or more sources. Analytics tools go beyond reporting by allowing users to analyse data and identify trends and patterns.
Some of the most popular BI tools and applications include:
BI is not a new concept. Many technologies and applications used today have been around for decades. The term “business intelligence” was widely used in the late 1990s. BI has become an essential part of decision-making processes.
Microsoft Power BI is a business intelligence platform that gives non-technical business people the means to gather, analyse, visualise, and share data. With its strong interaction with other Microsoft products, Power BI is a highly versatile self-service tool that requires little initial training. In addition, its user interface is very intuitive for Excel users.
Microsoft Power BI can connect to various data sources, including databases, on-premises software, and simple Excel spreadsheets. Anyone who can use Excel can also use Power BI, but the latter is more potent than its spreadsheet counterpart. Power BI is built on the foundation of Microsoft Excel. Thus, the learning curve is moderate.
Using data from an organisation, Microsoft Power BI produces reports and provides insights. Power BI can connect to various data sources and “tidies up” the information it receives to make it easier to process and comprehend. Other users can then access the reports and graphics produced with this data. It lets users view what has already occurred, what is happening now, and what might occur later.
Machine learning capabilities are included in Microsoft Power BI, allowing it to recognise patterns in data and use them to generate forecasts and “what if” scenarios. Users can create predictions using these estimates and prepare to meet future demand and other critical criteria.
Microsoft Power BI is the next level of business intelligence for organisations that want more robust reporting and analytical capabilities than Excel can provide.
Businesses can gather, examine, and analyse data from various departments using Power BI, which gives them a better understanding of their operations and performance and enables them to base their decisions on actual data. It can be used to inform decision-making, track KPIs, and more.
Businesses find it an appealing choice because of its many features, including:
Microsoft Power BI is a powerful business intelligence tool that can help businesses visualise data, spot trends, and make more informed decisions. If you’re looking for a BI tool that is easy to use, offers a variety of features, and is highly configurable, Power BI may be the right choice for your business.
For hundreds of data providers, apps, and services that include preset reports and visualisations, Power BI has hundreds of content packs, templates, and connections. You can use Microsoft Power BI to visualise the data you have in any of these services — whether you use Xero for accounting, K2 Cloud to develop business processes, Adobe Marketing Cloud, SAP HANA, Salesforce, MailChimp, Marketo, or Google Analytics — and to create reports against them as well as to combine them in a unique dashboard. In addition, the on-premises gateway can be configured so that you can use Power BI to explore data sets on your own servers.
By doing so, you’ll be able to compare website visitors with sales or identify the campaigns that have attracted new clients. To manage who has access to more sensitive data, you may construct your dashboards, reports, and visualisations, do calculations (Power BI refers to these as calculated measures), and define access levels for specific individuals, data sources, or dashboards and reports.
Charts are excellent for numbers, but Power BI’s new Timeline Storyteller is the way to go if you want to explain information that changes over time. This tool allows you to arrange dates or times in a straight list, circles, spirals, grids, or other unique shapes. A chronological list, a sequence that depicts the duration of events, or relative or logarithmic scales are further options.

Microsoft Power BI will create a timeline from the data you choose to represent, scale, and arrange. Then you may use that to describe anything else in which the order of events is essential, such as the history of your company, the growth of the demand, or anything else.
Excel allows you to compare situations, but Power BI enables you to drag a slider bar to display changes. Use the New Parameter button in Power BI Desktop to add parameters that vary in your What-if scenario. Add a calculated measure for a number, such as revenue.
Suppose you construct a What-if parameter for the number of customers that respond to a specific offer. You can enter that into a formula to illustrate how many customer support tickets you anticipate dealing with. This generates a calculated metric you can reference elsewhere.
Various visualisations are already included in Microsoft Power BI. Still, you can add more by downloading them from the Office Store or making your own with the free Power BI Custom Visual Tool. The Office Store offers both Microsoft’s visualisations and those made by Power BI users, such as word clouds, a correlation plot based on R script, and a “box and whisker plot” that emphasises outliers, clusters, and percentiles.
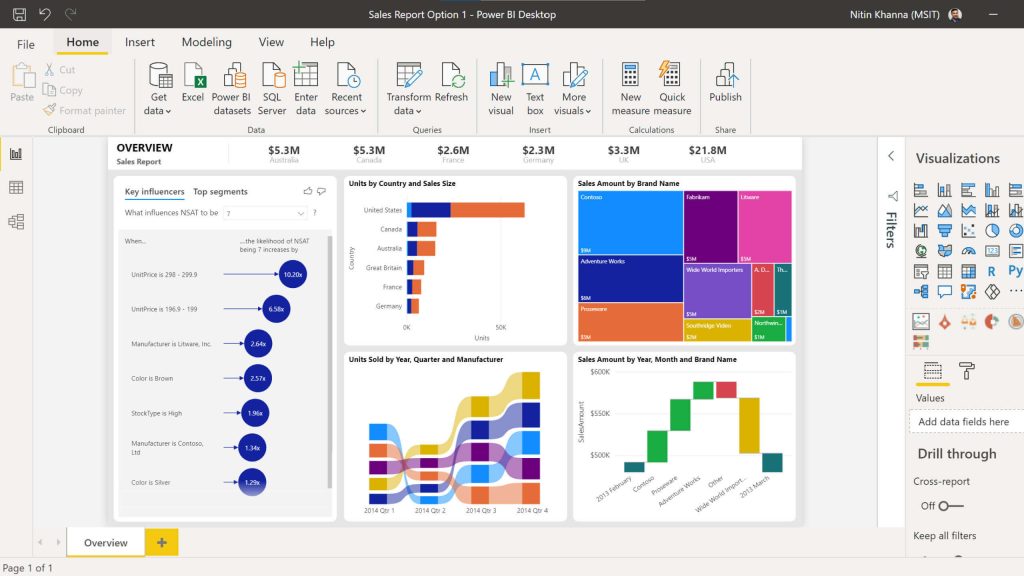
Photo courtesy: Microsoft Power BI
If you wish to track the development of workflows and processes, you can also integrate Visio diagrams into Power BI and use them as custom graphics. If you have Excel analytics models, you can use Frontline’s Analytic Solver to transform them into unique Power BI representations. You receive a dynamic model that you can drag and drop Power BI data sets onto to test or optimise different options, not a static report.
Machine learning is used in many of Microsoft Power BI’s interactive visualisations to find insights that often require a data scientist. Key drivers make it easier to recognise and rank influencing elements, such as what causes things to go on backorder.
The decomposition tree directs where to dive into the data when analysing the root cause, whereas anomaly detection finds outliers and other anomalies in time series data, such as line charts, and offers explanations. Smart Narratives can extract significant insights and trends and wrap them in automatically generated language to construct data tales for you.
Using data to gauge how effectively decisions serve the business can help a data-driven culture succeed. Use the Goals hub in Power BI Premium to connect scorecards to Microsoft Power BI reports rather than shelling out money for a particular solution to create dashboards for tracking performance and achievement on essential criteria.
You specify when you must reach a result by, how you plan to measure it, and choose the pertinent data points on a chart in a Power BI report for goals like revenue, sales, hiring, or user numbers. You can utilise Power Automate to start notifications or schedule meetings if performance towards a goal is behind, in addition to monitoring progress in the Goals hub.
Applying the same Microsoft Information Protection sensitivity labels in Office, SharePoint, and other products will allow CIOs and CISOs to ensure that only the appropriate staff members can access confidential company data when placed in Power BI. In addition, for end-to-end data leakage security, those labels enable auditing, enforce access in Power BI, and follow the data if exported to Excel or PowerPoint.
Power BI is an ideal place to store data sets that will be utilised for machine learning because its Data Flow feature makes it easy to automate data preparation and enrichment. In addition, business analysts may now benefit from machine learning without the requirement for a data scientist or an Azure membership, thanks to its integration of Azure Machine Learning AutoML.

When you specify the outcome you want to predict, such as whether a product will be out of stock, AutoML suggests the columns of data to use for the model, chooses and tunes the algorithm automatically, and provides information on the model’s performance and reliability as well as the features that affect its predictions of which products are most likely to be out of stock at specific distribution centres.
Microsoft Power BI allows you to create Power Automate workflows and insert Power Apps into reports. As a result, you can include the app or flow for acting on the report where you obtain the insights if it makes sense, such as adding a customer to an email marketing campaign or submitting a budget request.
The filters and selections you make in Power BI are then carried over to the app or workflow. You can integrate the Power BI report into the app for mobile users who are more likely to work from a Power app.
Users of BI require varying degrees of detail in their visualisations. Managers and business analysts may want a lot of information. Still, suppose your executives monitor 20 or 30 critical metrics for multiple global regions. In that case, it’s preferable to present that information quickly with a clear view that displays the target and the actual value rather than a more complex visualisation.
In a conference, you may rapidly look up information in this way without becoming bogged down in a sea of graphs and charts. Multiple report kinds are combined onto a single tile in the Power KPI custom visualisation.
People can use the information you share in Power BI inside of Excel. Microsoft Power BI can also power Excel’s data types, providing a single, reliable data source for entities like clients, vendors, products, and other corporate data. You gain access to a single source of truth, and Power BI is not necessary for Excel users to benefit from it.
If users wish to work with new columns from the data set in Excel, they can write in the information they want to search for, like a customer name, mark the range, and click on a tooltip.
The majority of BI is performed on data that is periodically drained from a database. Real-time streaming data is necessary if you wish to examine data from e-commerce websites or operational technology systems with sensors. In most cases, this necessitates some development work to extract the data.
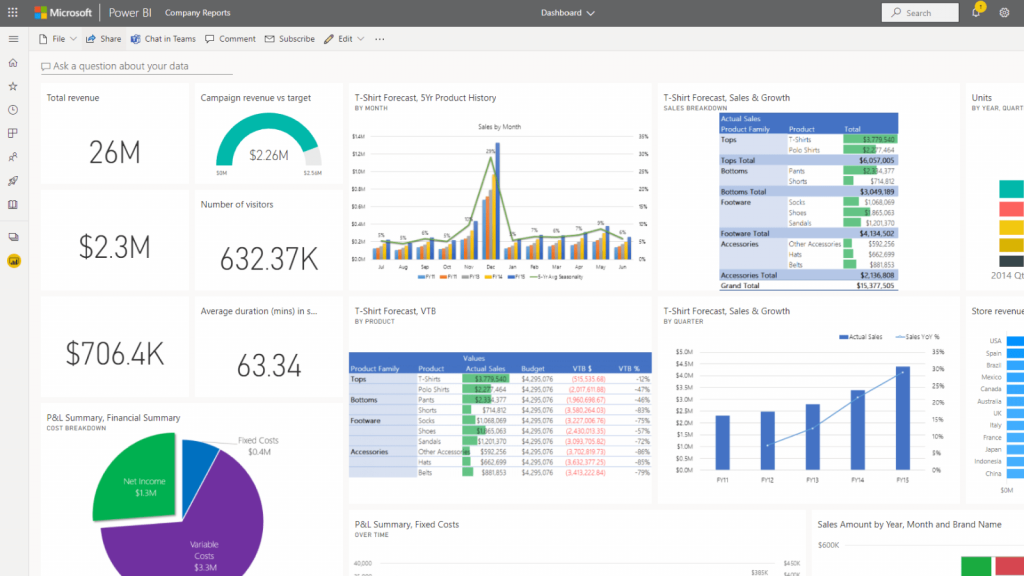
Image courtesy: Microsoft Power BI
Still, Microsoft Power BI’s streaming data flows can connect to Azure Streaming Analytics, allowing business analysts to combine batch and streaming data in the same reports to find exceptions, initiate actions, and respond faster to changes in physical systems.
The Power BI business intelligence solution for efficient Data Visualisation has streamlined the realm of business intelligence. This Microsoft business analytics application combines unprocessed data from several sources, such as a straightforward desktop spreadsheet and cloud-based data.
Due to its adaptability and the need for little training, it can be used by non-technical individuals to evaluate and exchange data visually. Also, it is straightforward, quick, robust, and enterprise-grade. Furthermore, this indicates that it is prepared for effective modelling, real-time analytics, and customised development.
This business analytics service consists of Power BI Desktop, a Windows desktop program, the Power BI service, an online SaaS software service, and Power BI mobile apps for Windows, iOS, and Android devices.
Microsoft Power BI Desktop, the service, and mobile apps are the three components that enable individuals to produce and share business insights for better decision-making. However, there is also a fourth component. The Power BI Report Server is what it is called. Following their creation in Power BI Desktop, it enables you to publish Power BI reports to an on-premises report server.
The business intelligence tool as a whole marvellously assists you in connecting different data sources, cleaning them up, and transforming them into a data model for understandable Data Visualisation. However, how you use each Microsoft Power BI component may vary depending on your current position within a team or project. You might, for instance, be utilising the Power BI service.
However, a business report maker who performs a lot of number crunching within your organisation may be using Power BI Desktop heavily to build reports and then post them to the Power BI service, where you can read them.
Similarly, another employee who works in sales might need to track sales quota progress and enter information for new sales leads using the Power BI phone app. Developers can incorporate dashboards and reports into their applications or push data into datasets using the Power BI APIs.
All in all, it has been Microsoft’s Business Analytics service that has enabled us to connect easily to hundreds of data sources and give our data life through enticing dashboards and thorough reports.
Microsoft Power BI is available in both free and paid versions. Microsoft Power BI costs depend on your chosen version and the features you need.

The free version of Power BI includes essential features such as data connectivity and modelling, visualisations, and sharing. The paid version, Power BI Pro, includes additional collaboration and content pack publishing features. Power BI Pro is available for $9.99 per user per month.
Additionally, Power BI Premium is a cloud-based enterprise solution that provides dedicated resources and SLAs. Power BI Premium is available in three pricing tiers, depending on the capacity you need:
If you’re unsure which version of Power BI is suitable for you, Microsoft offers a free trial of Power BI Pro.
Moreover, Microsoft Power BI Pro consists of a series of iOS and Android mobile apps, an online service called Power BI, and a Windows desktop application called Power BI Desktop. These three elements enable the user to exchange and visualise data across many devices and generate visualisations from data gathered from various sources. As a result, it is the most efficient method for business intelligence since it connects many data sources, enables analysis, and facilitates future projections.
To conclude, Microsoft Power BI can help you analyse your data and make better decisions for your company. It’s easy to use and customised to your organisation’s specific needs. Microsoft Power BI is definitely worth considering if you want to improve your decision-making process or simply need a better way to track and report on your data.
If you need more information on Microsoft Power BI (or any other software solutions), feel free to book in a time with us for a further discussion.
November 07, 2022